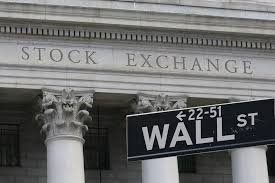
A 156-Year Market Warning Is Flashing Red for Wall Street
A rare historical valuation signal is flashing for only the second time in 156 years, pointing to a potential major stock market correction.

Wall Street is partying like it is 1999. But a shadow from the late 19th century is creeping across the trading floor.
For only the second time in nearly 156 years of recorded financial history, a key valuation metric has crossed into dangerous territory. It is a signal that has historically spelled disaster for both everyday retail investors and institutional giants on Wall Street.
The benchmark S&P 500 and tech-heavy Nasdaq Composite have spent much of the year breaking records. They have done so by ignoring a staggering list of global headaches. Sticky inflation, geopolitical tensions, new tariff proposals from Washington, and high Treasury yields have done little to cool the market’s engines. Yet, underneath this glossy surface, the numbers tell a much grimmer story.
The 156-Year Warning Light
Valuing the stock market is a notoriously tricky task. Emotions, hype, and short-term trends often warp stock prices, making everyday predictions unreliable. But long-term tools offer a much clearer picture of market health.
The warning signal flashing today comes from the Cyclically Adjusted Price-to-Earnings ratio. Widely known as the Shiller PE ratio, this metric was popularized by Yale University economist and Nobel laureate Robert Shiller in the late 1980s.
Traditional price-to-earnings ratios look at corporate profits over the past year. Shiller’s version takes a wider view, measuring price against average inflation-adjusted earnings over the past decade. This smoothing effect removes the noise of short-term economic shocks, showing whether stocks are genuinely cheap or dangerously overpriced.
The Shiller PE ratio has recently pushed past 38. In the 155-year history of the index, this extreme level has only been breached once before. That was during the peak of the dot-com bubble, right before the Nasdaq lost more than three-quarters of its value.
What History Tells Us About High Valuations
History is not a perfect mirror for the future. However, it is an incredibly reliable guide. Every time the Shiller PE ratio has climbed past certain historical thresholds, a massive market correction has followed.
In 1929, the ratio peaked at 32.6 right before the Great Depression triggered a historic collapse. In the late 1990s, during the internet boom, the ratio reached its all-time high of 44.19. What followed was a brutal, multi-year bear market that wiped out trillions of dollars in paper wealth.
Even during the housing bubble of the mid-2000s, the ratio never came close to the levels seen today. The current reading of over 38 indicates that investors are paying incredibly steep premiums for every dollar of corporate profit. Historically, when the rubber band stretches this far, it eventually snaps back with immense force.
The AI Hype Machine and the Magnificent Seven
So, what is driving this unprecedented surge in valuations? The answer lies in the massive concentration of wealth at the top of the stock market. A small handful of tech giants, often called the Magnificent Seven, are doing most of the heavy lifting.
Artificial intelligence has sparked a modern gold rush. Companies like Nvidia have seen their stock prices skyrocket as tech firms race to build out infrastructure. Investors have flooded into these names, bidding up prices to levels that assume flawless execution for years to come.
- Market concentration is at its highest level since the Great Depression.
- A few mega-cap tech stocks account for a massive share of the S&P 500’s total value.
- This lack of market breadth means that if tech falters, the entire index goes down with it.
This dynamic has created a fragile market structure. While these tech giants are highly profitable, their massive valuations leave no room for error. Any sign of slowing growth or delayed returns on AI investments could trigger a massive wave of selling.
Macroeconomic Headwinds Build
The high valuation of today’s market is even more surprising when looking at the broader economic landscape. Wall Street is currently defying several major headwinds that would normally depress stock prices.
The Federal Reserve has kept interest rates elevated in its fight against inflation. High rates make borrowing more expensive for companies, which theoretically slows down earnings growth. Meanwhile, long-term Treasury yields have hovered near their highest levels since the financial crisis, offering investors a safe, high-yielding alternative to risky equities.
Geopolitical instability and trade tensions also continue to brew. Proposed tariffs could disrupt global supply chains and reignite inflation. In the past, this mix of high interest rates, trade friction, and geopolitical risk would have sent investors running for cover. Instead, the market has marched higher, driven by momentum and fear of missing out.
How Investors Should Prepare
This warning does not mean investors should panic and sell everything. Markets can remain irrational and overpriced far longer than analysts expect. Trying to time the exact top of a market bubble is a quick way to lose money.
However, history suggests that caution is warranted. Diversification remains the best defense against a sudden market downturn. Investors may want to look beyond the high-flying tech sector toward more defensive, value-oriented areas of the market that have been left behind in this rally.
The laws of economic gravity have not been repealed. Eventually, stock prices must align with corporate earnings. When that day comes, those who chased the highest-flying stocks at peak valuations will likely bear the brunt of the pain.